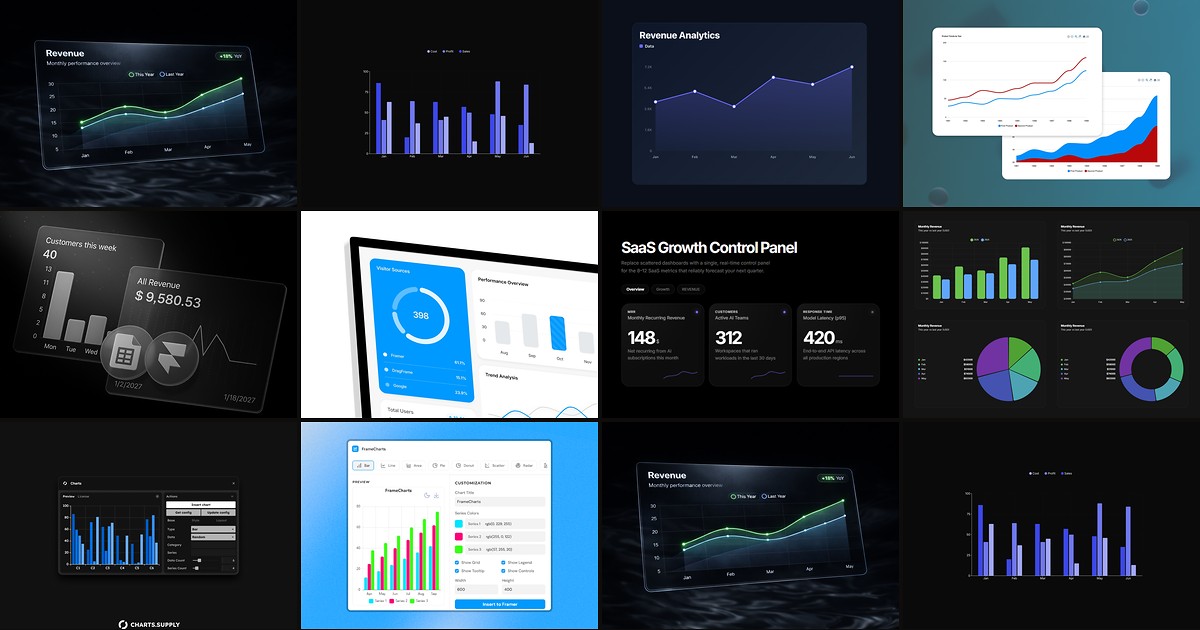
Static chart screenshots are the fastest way to make a data-driven Framer page feel outdated — the moment a client updates a spreadsheet, your hero metrics lie. The best framer chart component options keep numbers editable in the property panel, sync from Google Sheets or JSON APIs, and render natively on the canvas so breakpoints stay crisp without iframe embeds.
This list ranks ten chart and data visualization tools verified live in July 2026: marketplace components and plugins with working install links, identifiable creators, and clear use cases for dashboards, KPI blocks, and investor-style landing pages. Every pick ships a demo or preview you can inspect before buying — five free and five paid so you can prototype metrics sections without a budget and upgrade when live data or advanced chart types matter.
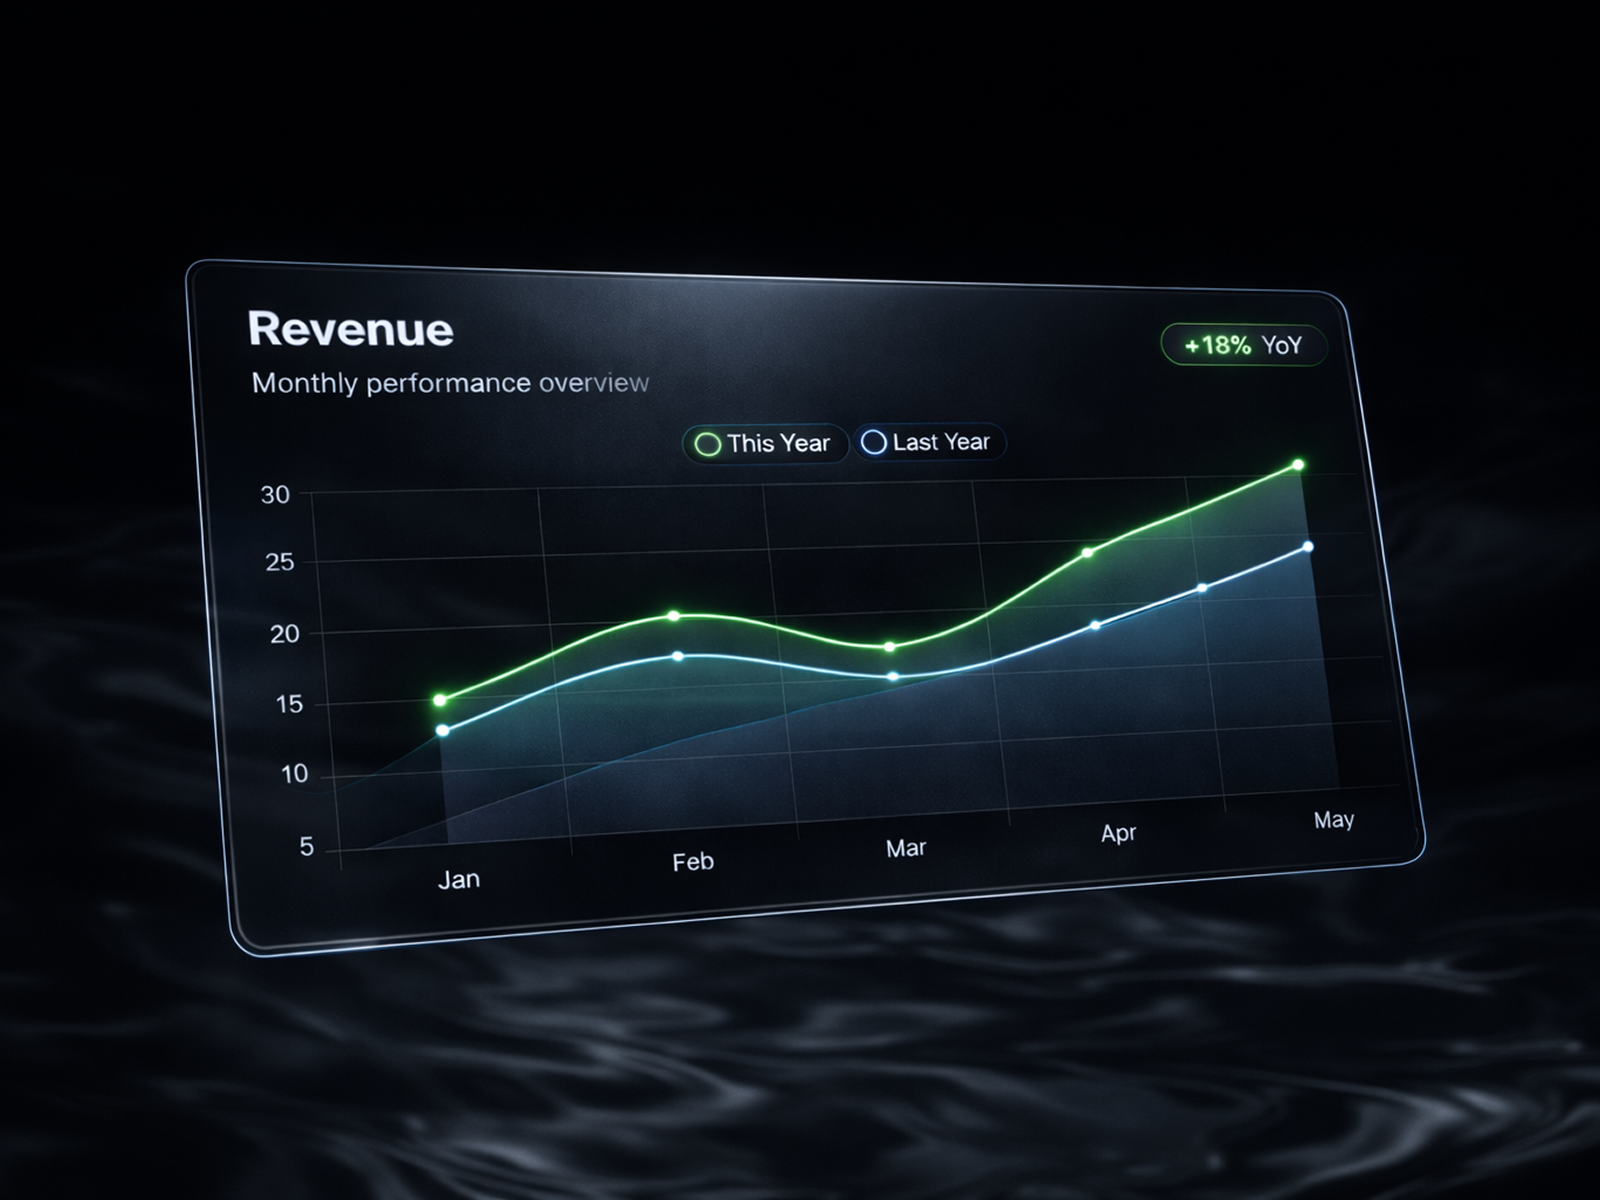
Framer ChartJS — Native ChartJS v4 with six chart types, five datasets, and goal-line overlays
by Zlatko Marjanović
Framer ChartJS is the strongest free chart stack on the marketplace: six chart types, five independent datasets, sparkline mode, compact K/M/B number formatting, and optional goal-line overlays — all running natively inside Framer on ChartJS v4. Property-panel toggles rebuild the chart on every edit, and resize handling stays stable inside auto-layout frames. Install it first on any metrics section; most landing pages never need more until the brief says “pull from Google Sheets.”
- Best for
- SaaS and fintech pages that need production-grade charts without paying for live API sync on day one
Affiliate link — we may earn a commission at no extra cost to you.
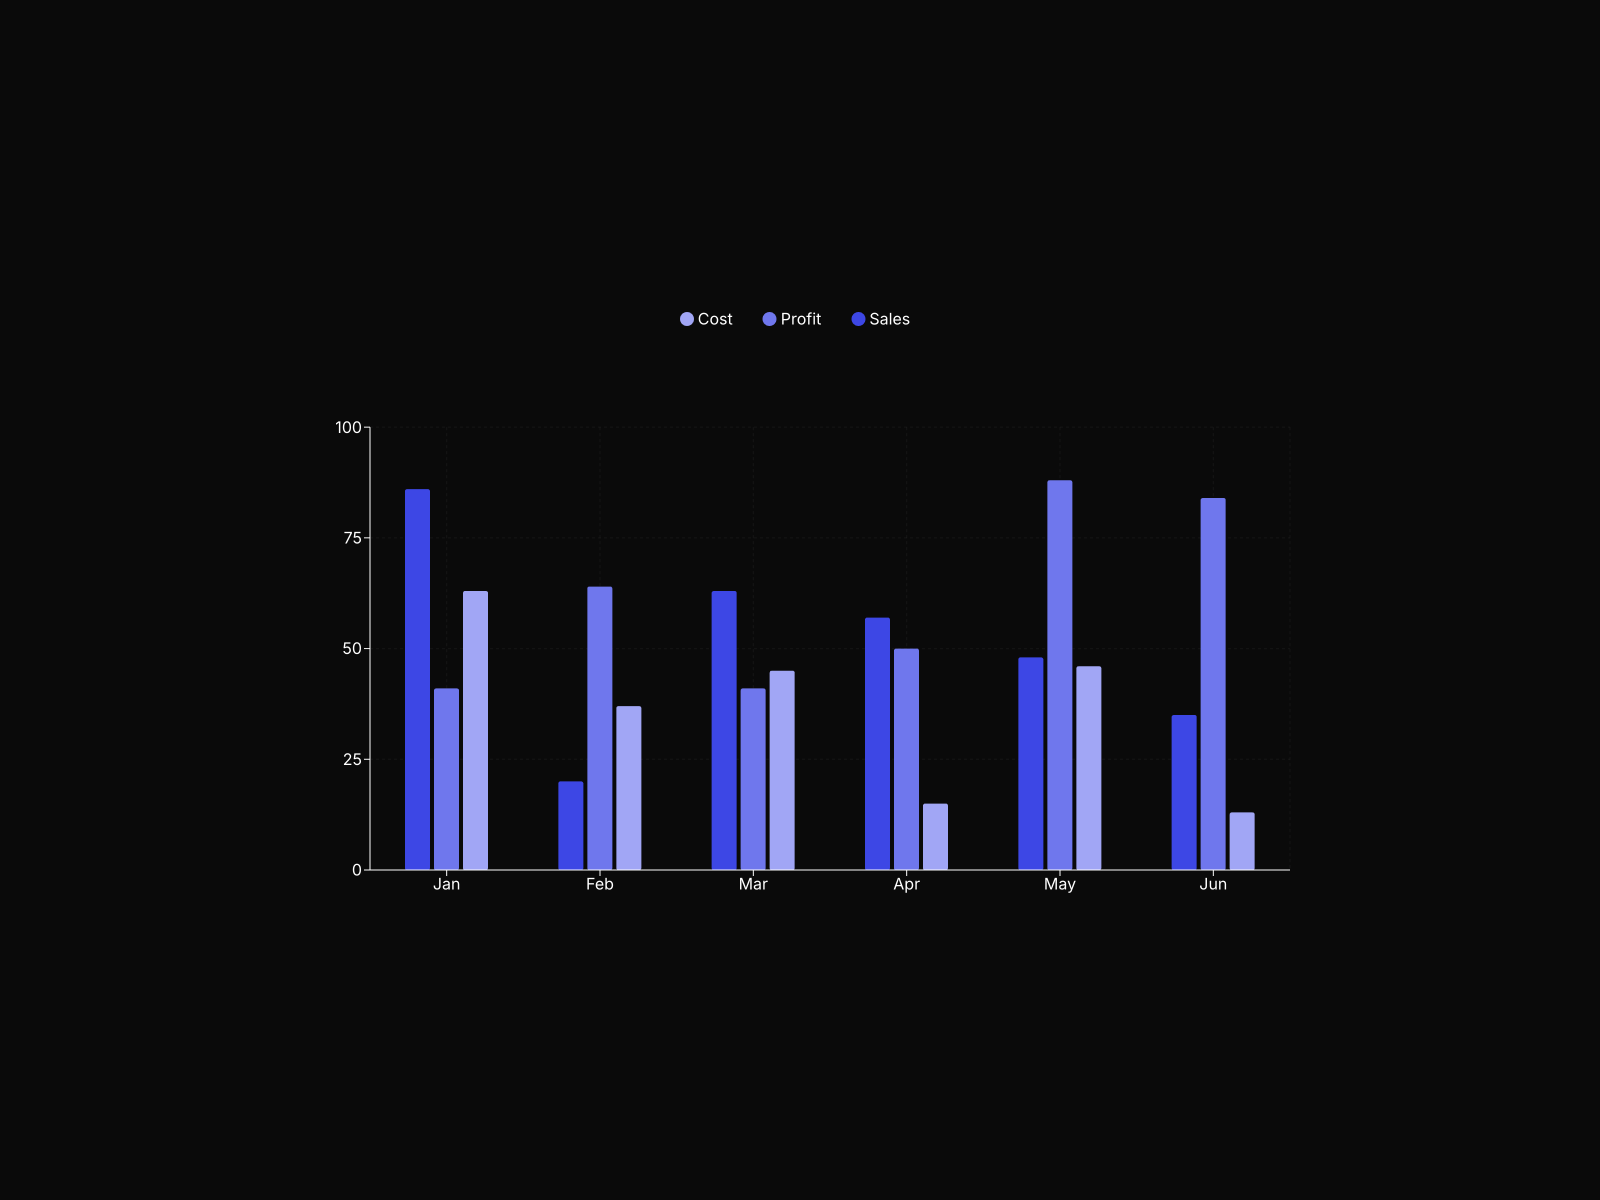
Charts for Framer — Bar, line, pie, radar, and scatter charts with Google Sheets and API live sync
by V2SPACE
Charts for Framer from V2SPACE is the default paid upgrade when static panel data is not enough: connect a published Google Sheets CSV URL or any JSON/CSV API endpoint, and the component refreshes as source numbers change. Switch between bar, line, pie, radar, and scatter layouts from one instance, tweak typography and corner radii to match your design system, and use random mode to fill placeholder charts during wireframes. At 19 USD one-time, it replaces the weekly export-and-reupload loop agencies run on investor update pages.
- Best for
- Marketing and product teams that update metrics in a spreadsheet and want the published site to follow automatically
Affiliate link — we may earn a commission at no extra cost to you.
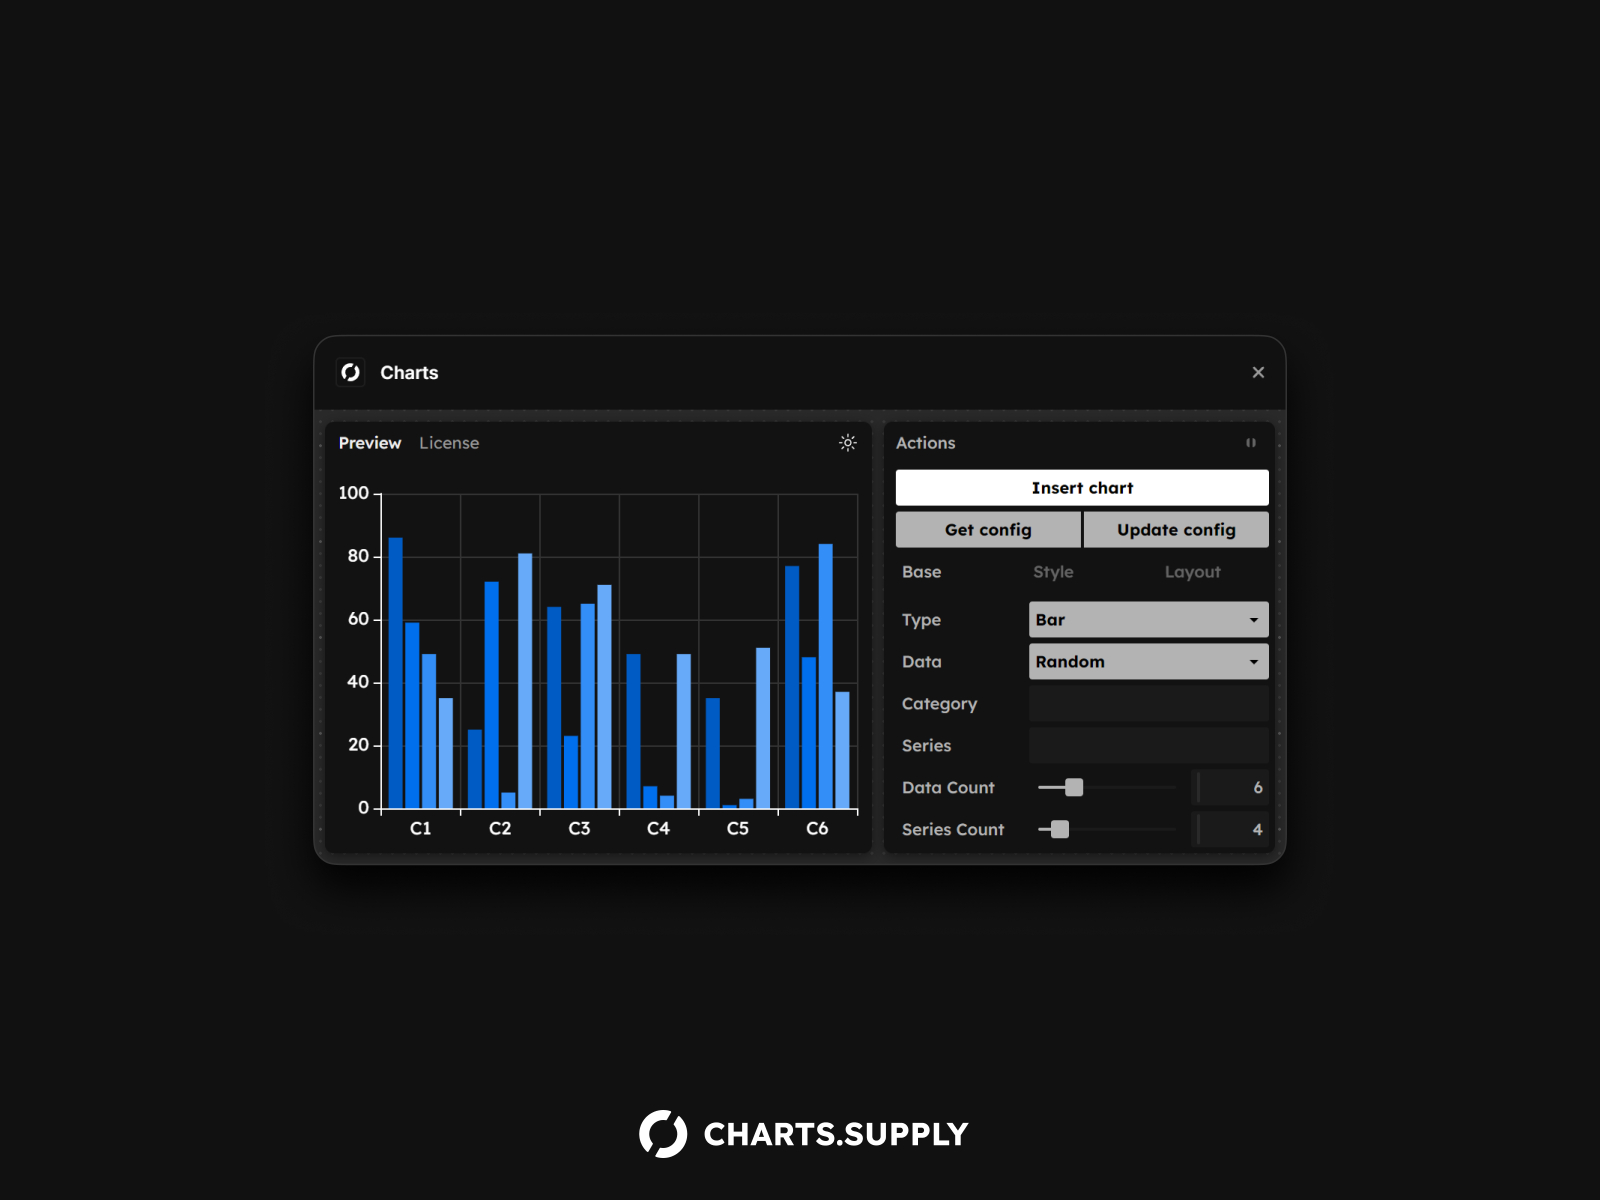
Charts for Framer Plugin — Build charts inside the editor with spreadsheet entry and live data connections
by V2SPACE
The companion Charts for Framer plugin mirrors the component’s data story but optimizes for editor workflow: type values into a built-in grid, paste API URLs, or wire Google Sheets, then insert the finished chart directly onto your page. The free tier covers bar and pie charts; Pro unlocks line, mixed, scatter, radar, candlestick, and heatmap types with a single-user license. Pair the plugin with the paid component when your team splits data setup (plugin) from layout polish (canvas components).
- Best for
- Designers who prefer configuring charts in a plugin panel before dropping finished components on the canvas
Affiliate link — we may earn a commission at no extra cost to you.
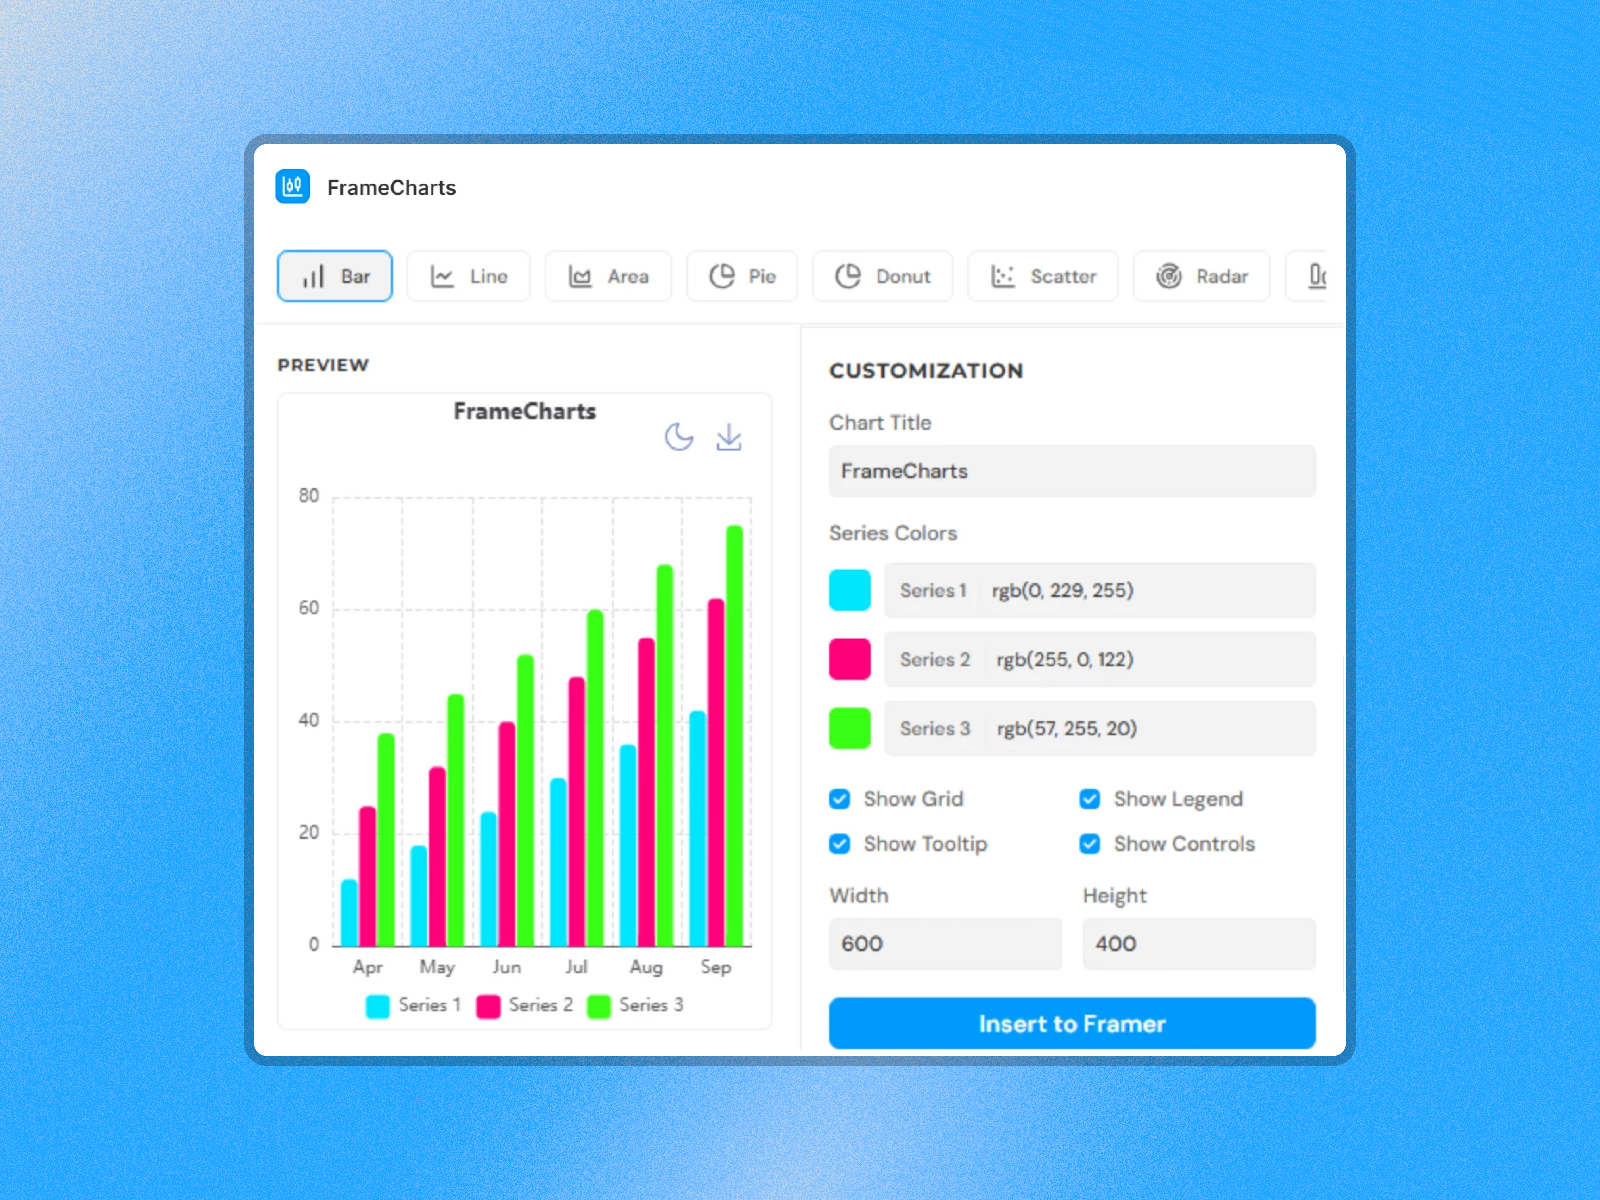
FrameCharts — Nine chart types with spreadsheet entry, CSV paste, and PNG export
FrameCharts from Soubhagya Sahu (the creator behind FrameSEO) is a free plugin that inserts production-ready chart components from a live preview panel — nine types including stacked bar, scatter, radar, and combo, with light/dark preview toggles. Paste CSV, edit in a spreadsheet UI, export a high-res PNG when stakeholders want a static asset, or drop the native component when the chart should stay editable. It is the best zero-cost plugin workflow when V2SPACE’s live sync is overkill but ChartJS Pro’s panel feels too developer-oriented.
- Best for
- Fast client launches that need bar, area, radar, or combo charts without subscribing to a data service
Affiliate link — we may earn a commission at no extra cost to you.
DataVizPro — Line, bar, and area charts with five themes and API loading states
by Can Girgin
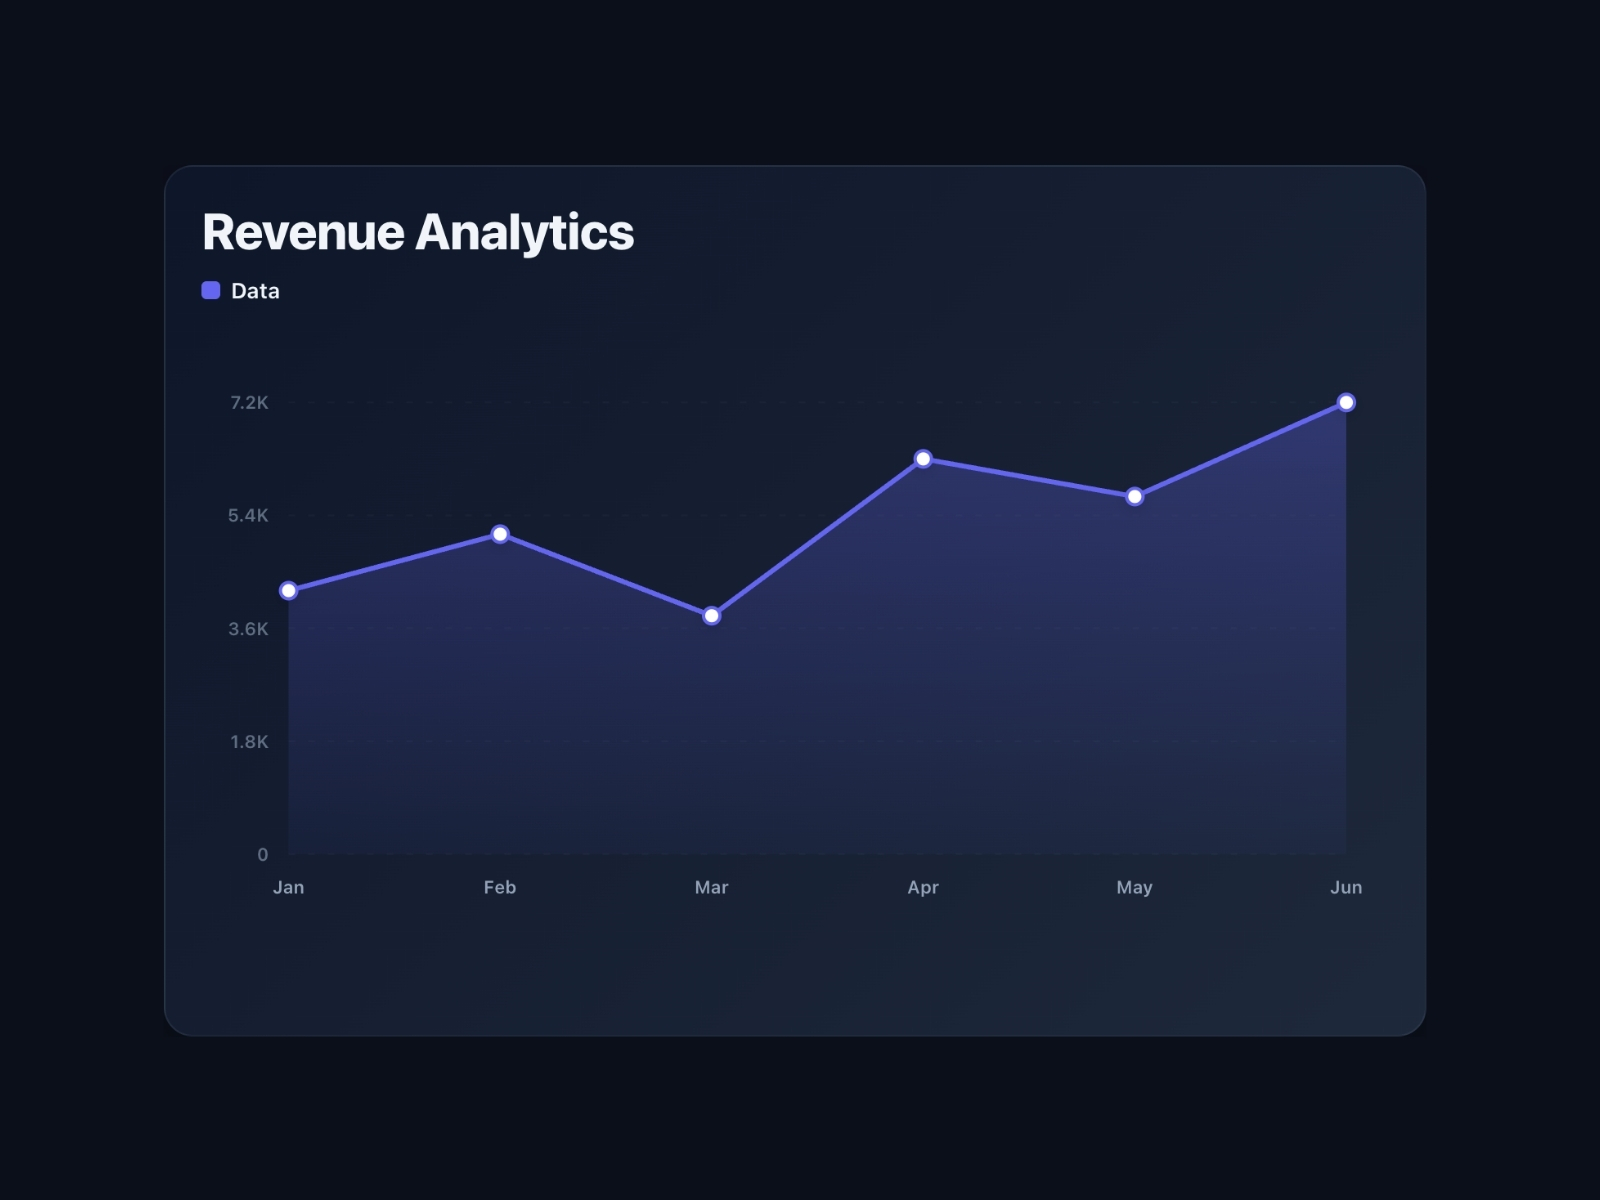
DataVizPro focuses on fit-to-frame responsiveness: line, bar, and area charts that scale inside any Framer frame with smart padding and label sizing down to 390px widths. Feed manual values, CSV, or a live API URL — loading and error states are built in so published sites do not flash empty shells while JSON loads. Five themes (light, dark, neon, minimal, glassmorphism) ship out of the box, and Can Girgin documents 6–12 data points as the sweet spot for readability. At 8 USD it is the budget paid pick when you need API hooks and mobile-safe layout without V2SPACE’s full chart-type catalog.
- Best for
- Dashboard sections on mobile-heavy sites where charts must fit frames without horizontal overflow
Affiliate link — we may earn a commission at no extra cost to you.
Apex Chart — ApexCharts-powered line, bar, area, scatter, pie, and donut visualizations
by Zeroqode
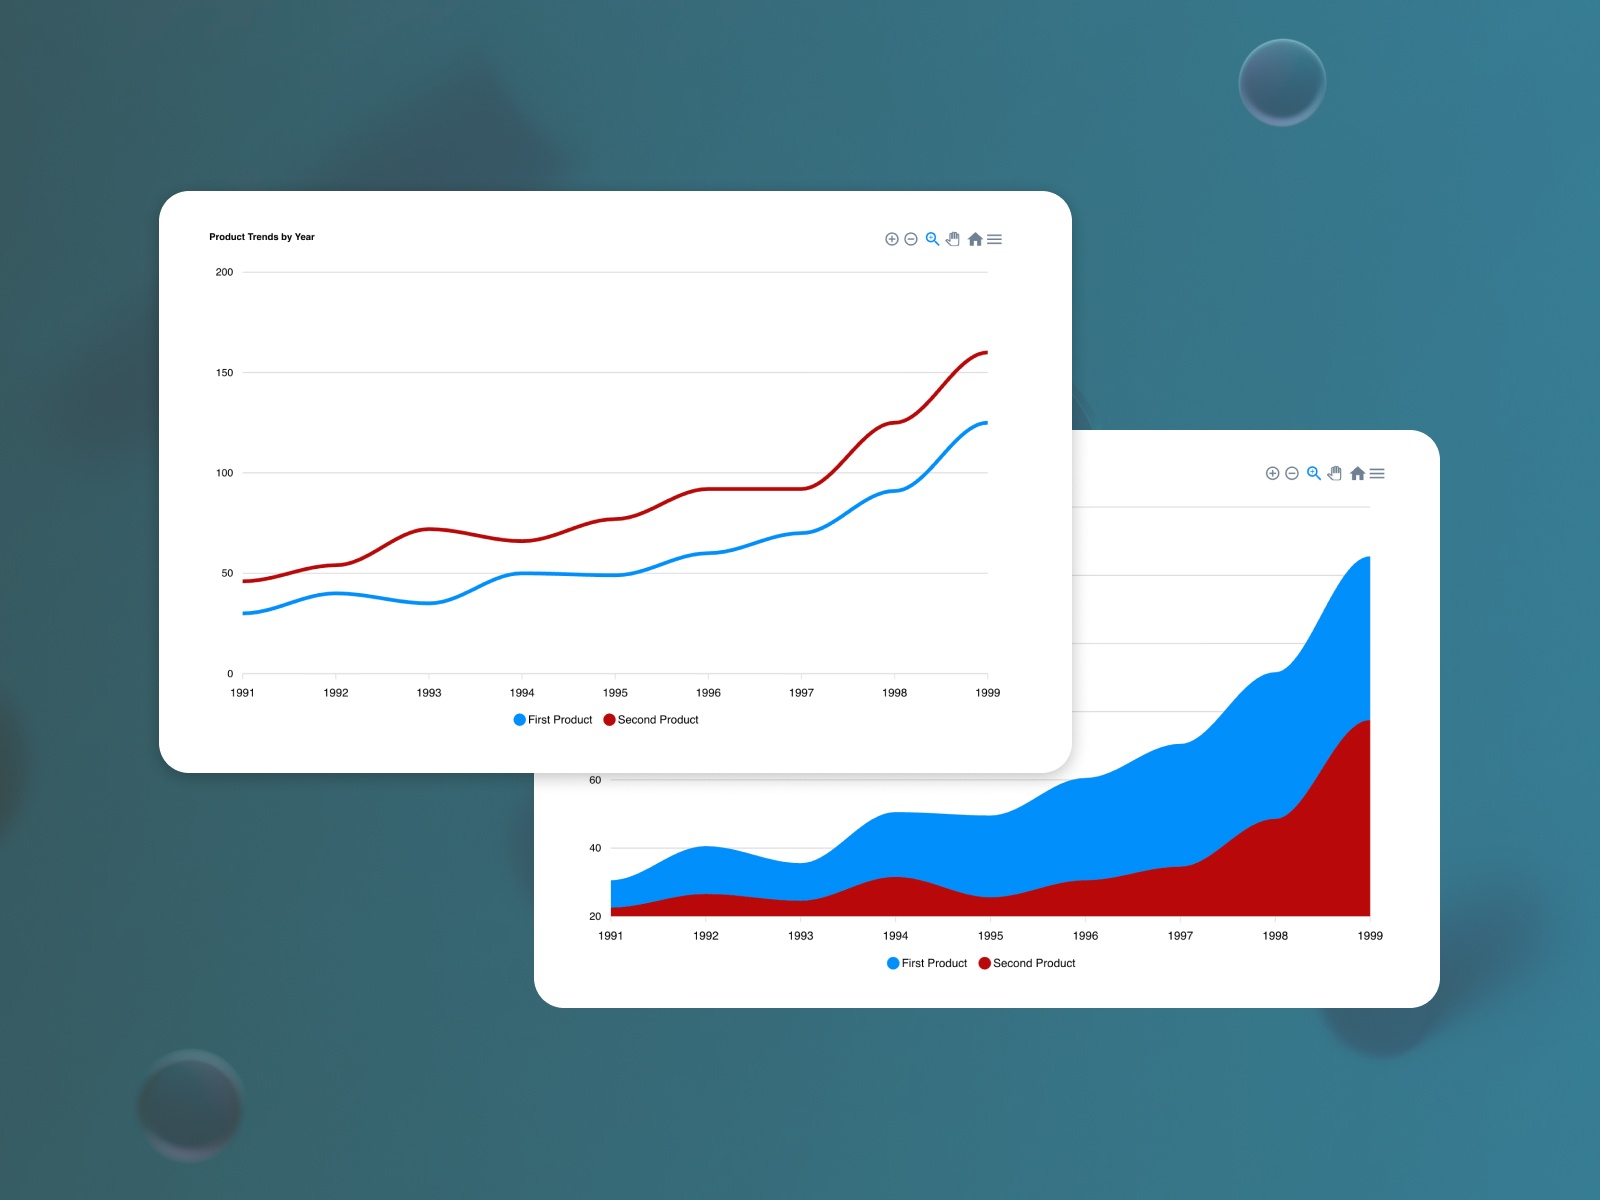
Zeroqode’s Apex Chart component wraps the ApexCharts library for Framer builders who want interaction depth — zoom, hover tooltips, and smooth animations on line, bar, area, scatter, pie, and donut types. Connect or paste data from the property panel, tune colors and typography to your brand, and publish without hosting a separate charting dashboard. At 10 USD with Zeroqode support behind it, this is the pick when ChartJS Pro covers basics but the brief asks for Apex-grade interactivity on a financial or education dashboard mockup.
- Best for
- Analytics-style interfaces that need zoom, tooltips, and interactive hover on dense datasets
Affiliate link — we may earn a commission at no extra cost to you.
Sheets Visualizer — Google Sheets tables, line charts, and bar charts that update when the sheet changes
by Nabeel
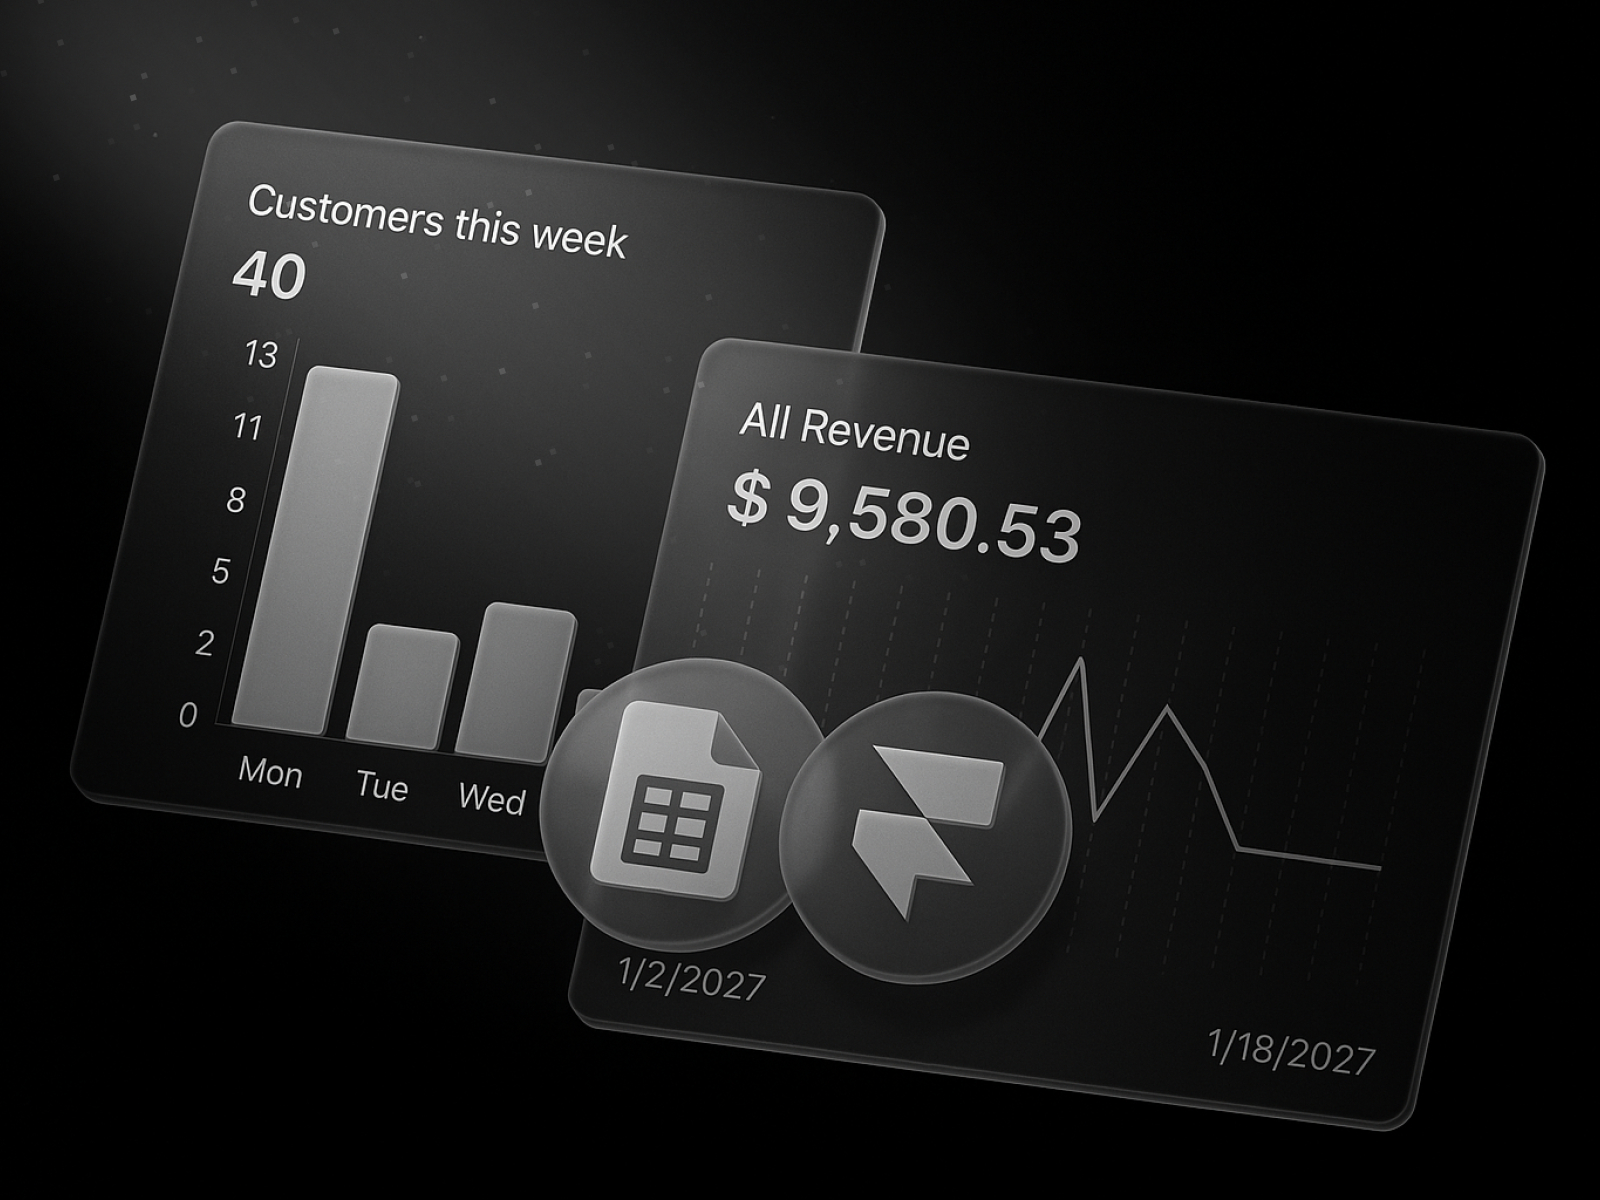
Sheets Visualizer connects published Google Sheets directly to Framer — display formatted text, full tables, line charts, or bar charts that refresh when the source sheet updates. Column letters in the property panel map labels and values without backend code, and Nabeel’s sample file documents the publish-to-web workflow step by step. At 15 USD it costs more than manual ChartJS entry but wins when the client team lives in Google Sheets and expects the marketing site to mirror their internal tracker automatically.
- Best for
- Personal trackers, live KPI walls, and client dashboards backed by a shared spreadsheet non-developers can edit
Affiliate link — we may earn a commission at no extra cost to you.
Analytics Dashboard — Dashboard pack with stat cards, bar charts, and segment counters
by Dragframe
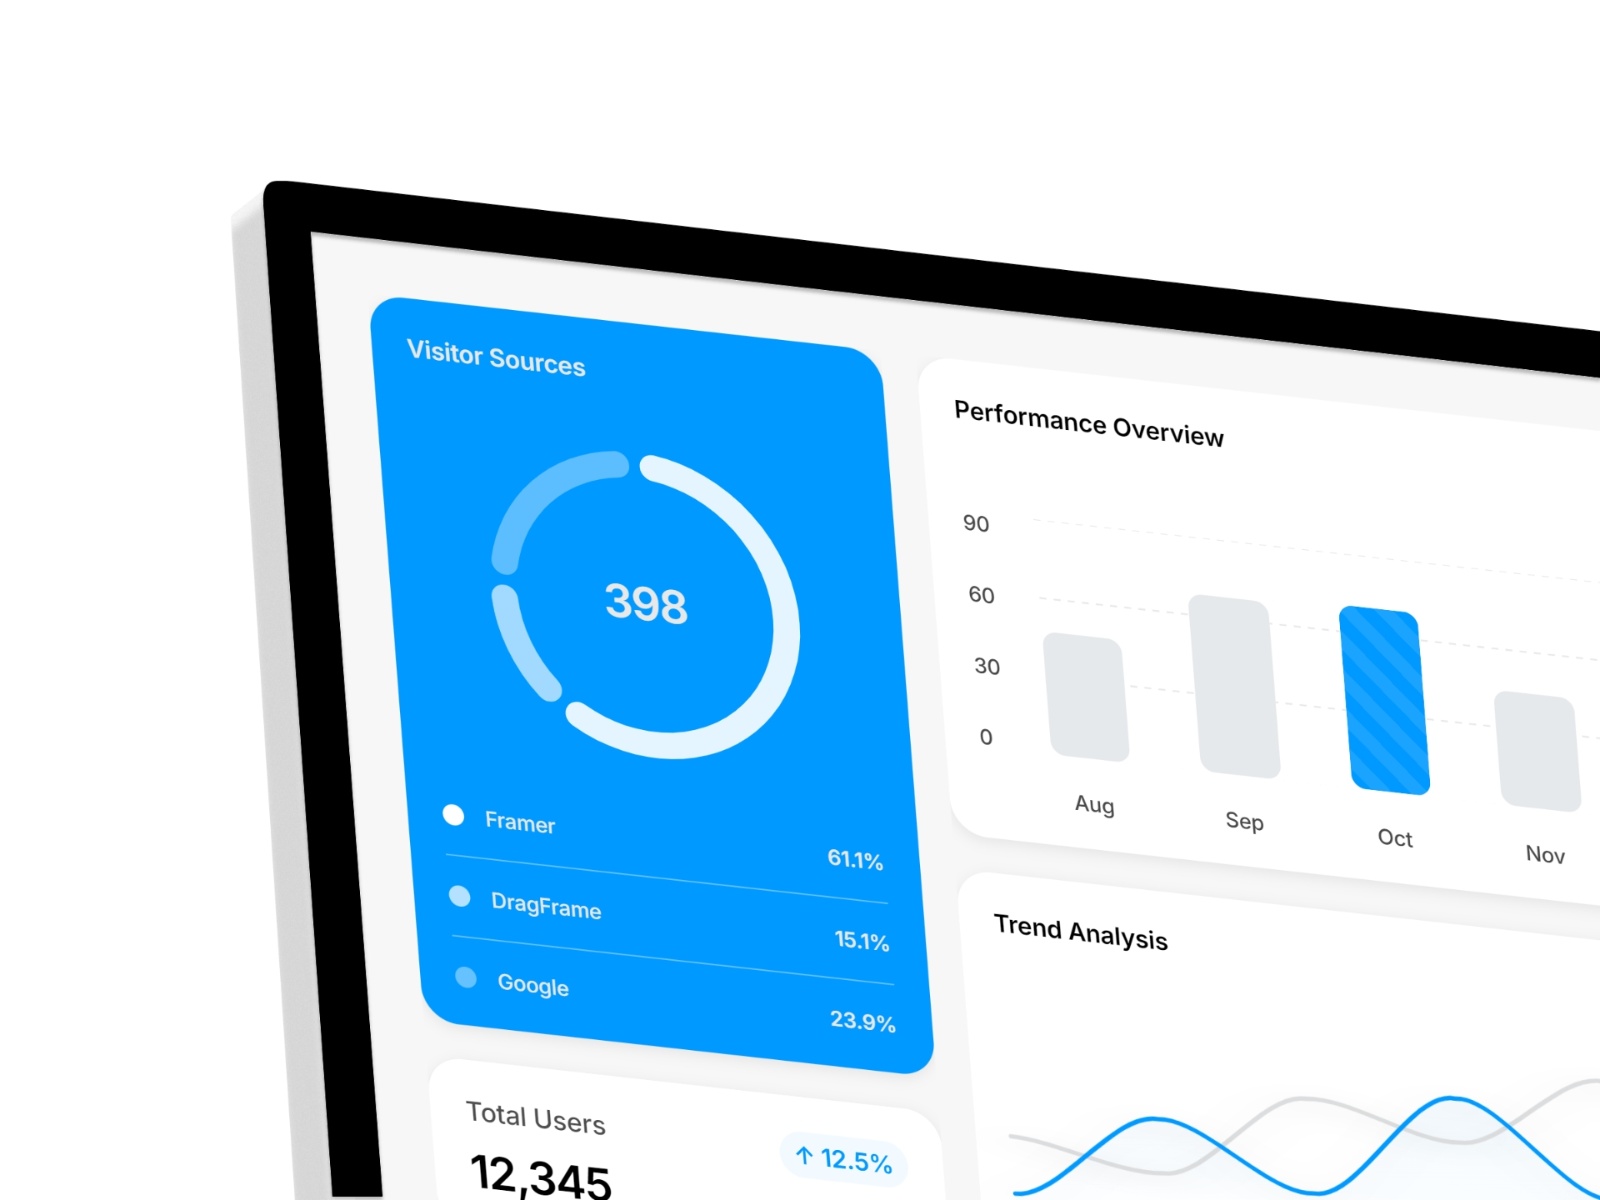
Dragframe’s Analytics Dashboard is a free component pack — not a single chart — with segment visual counters, bar chart sections, status KPI cards, and table layouts tuned for SaaS marketing pages. Colors, values, and layout slots adjust from the property panel, and the minimal UI style drops into dark or light heroes without clashing with your typography. Reach for it when the page needs to look like a product dashboard for a demo video or investor preview, and individual ChartJS instances would take too long to compose.
- Best for
- Startup landing pages that need a credible analytics UI block without building charts from scratch
Affiliate link — we may earn a commission at no extra cost to you.
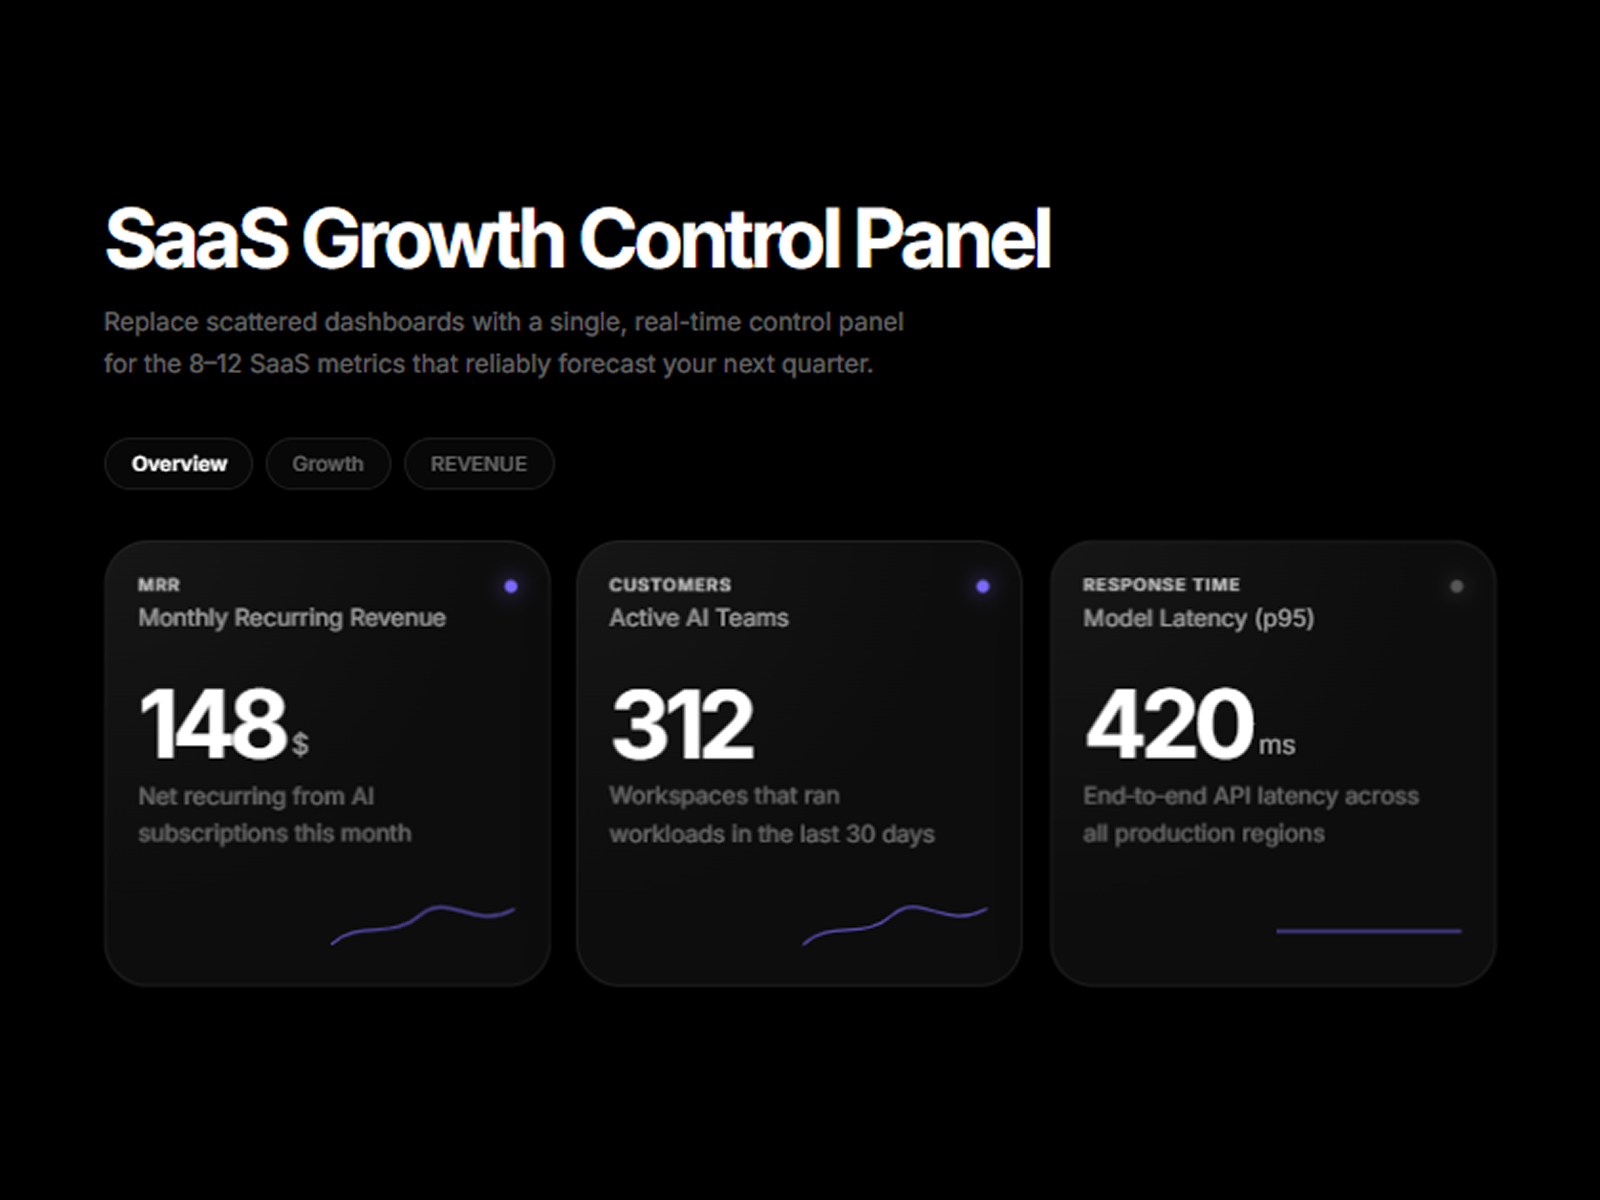
Metrics Grid — Tabbed KPI grid with count-up values, sparklines, and trend indicators
by Design by Saqlain
Metrics Grid presents business metrics in a trading-desk layout: tabbed categories, animated count-up figures, optional sparklines, and trend dots that signal up, down, or flat movement. Toggle the category bar, auto-rotate tabs, and edit eyebrow labels, suffixes, and subtext per card — all without touching chart axes. At 10 USD it complements true chart components on the same page; use it for hero-level credibility numbers and pair with Framer ChartJS or Charts for Framer when you need literal time-series graphs below the fold.
- Best for
- Investor-style proof sections where narrative metrics matter more than precise axis labels
Affiliate link — we may earn a commission at no extra cost to you.
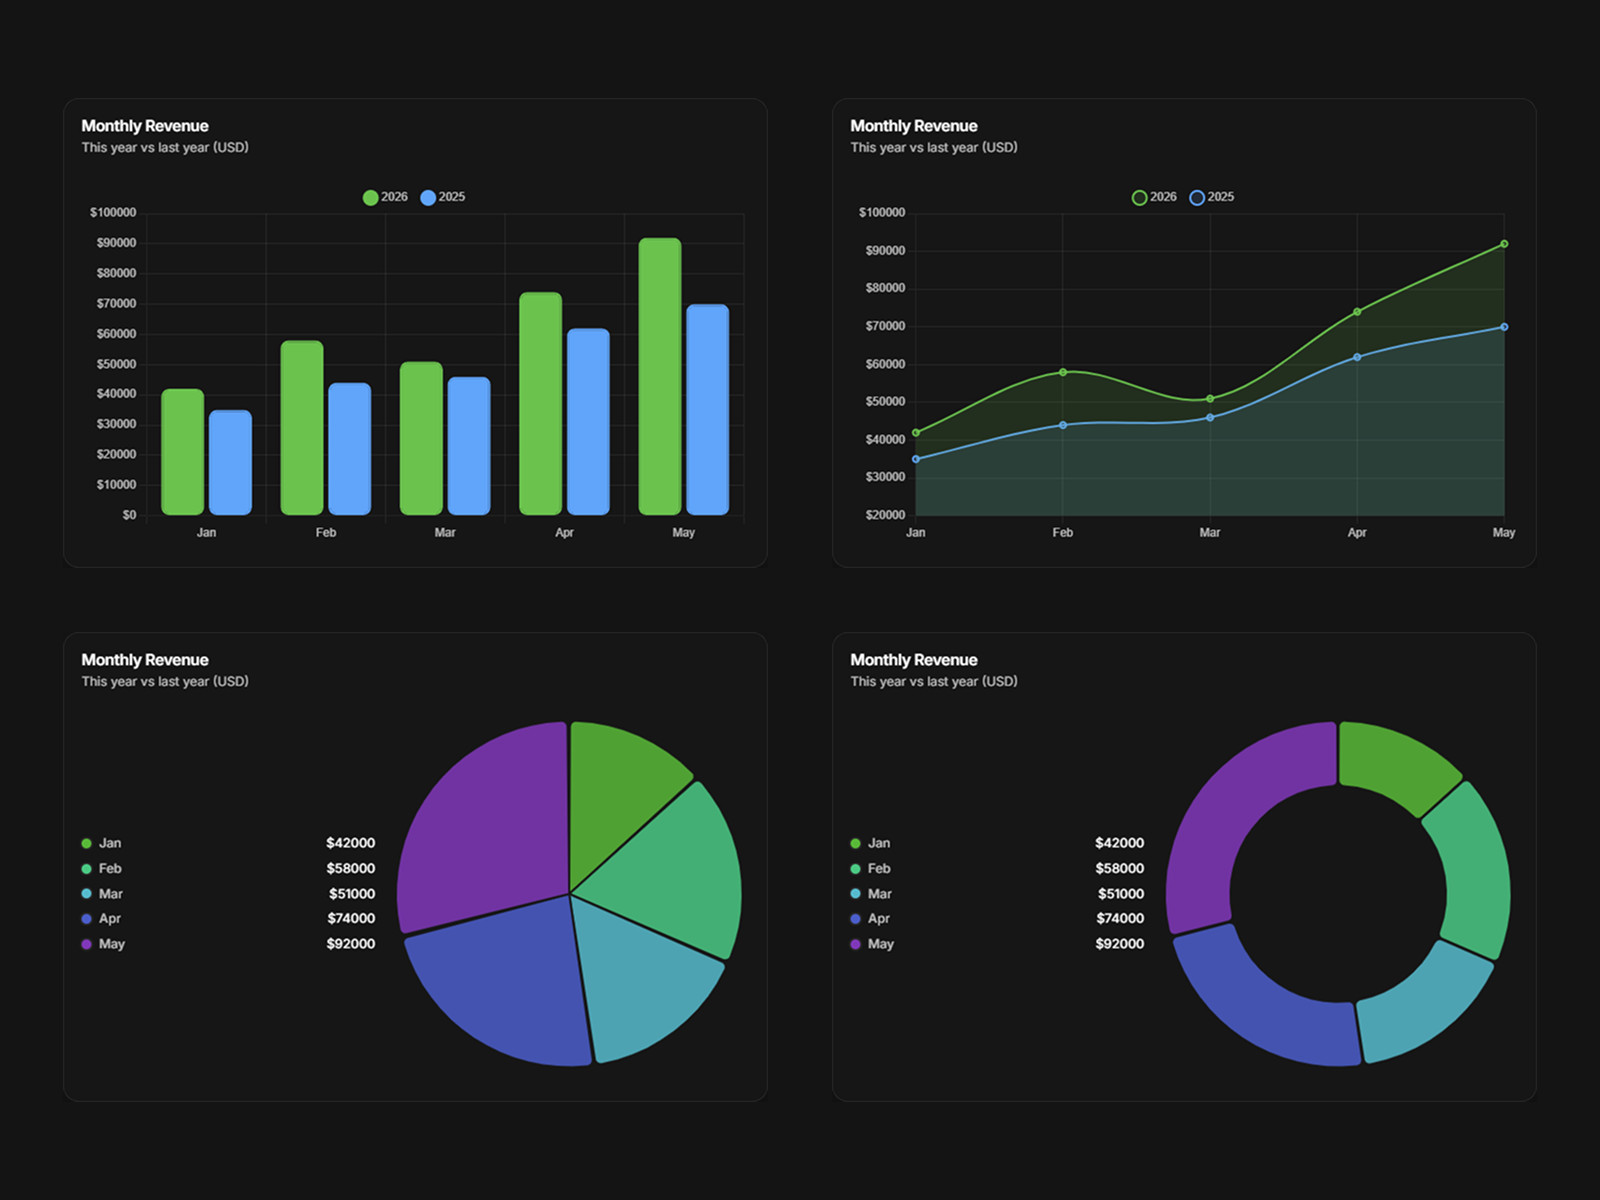
Chart Visual — Lightweight chart block for simple bar and line presentations
by Bhargav
Chart Visual from Bhargav is a free, lightweight chart block for straightforward bar and line presentations when ChartJS Pro’s five-dataset panel feels like overkill. Drop it into feature sections or slide-deck-style layouts, adjust colors from the property controls, and ship. It will not replace live API sync or Google Sheets workflows, but it closes the gap on small agency sites that just need one credible graph beside a case-study paragraph.
- Best for
- Quick mockups and internal pages that need a readable chart without configuring datasets
Affiliate link — we may earn a commission at no extra cost to you.
Quick comparison
| Resource | Price | Type | Best for |
|---|---|---|---|
| Framer ChartJS | Free | Component | Native ChartJS v4 with multi-dataset control |
| Charts for Framer | 19 USD | Component | Google Sheets and API live sync |
| Charts for Framer Plugin | Free tier | Plugin | In-editor chart builder with Pro chart types |
| FrameCharts | Free | Plugin | Nine chart types with CSV and PNG export |
| DataVizPro | 8 USD | Component | Mobile-safe API charts with loading states |
| Apex Chart | 10 USD | Component | Interactive ApexCharts with zoom and tooltips |
| Sheets Visualizer | 15 USD | Component | Real-time Google Sheets line and bar charts |
| Analytics Dashboard | Free | Component | Pre-built dashboard UI pack |
| Metrics Grid | 10 USD | Component | Tabbed KPI grid with sparklines |
| Chart Visual | Free | Component | Simple bar and line mockups |
How to choose the right Framer chart component
Static vs live data. Framer ChartJS, FrameCharts, and Chart Visual handle panel-entered or CSV data — enough for launch pages with monthly manual updates. When numbers must track a spreadsheet or API without republishing, Charts for Framer, DataVizPro, or Sheets Visualizer earn their price.
Component vs plugin workflow. Plugins (FrameCharts, Charts for Framer Plugin) suit teams that configure data once in a side panel and insert finished charts. Components suit designers who tune chart styling directly on the canvas alongside hero typography.
Dashboard UI vs true charts. Analytics Dashboard and Metrics Grid communicate credibility through KPI layout and motion — not axis precision. Pair them with Framer ChartJS or Charts for Framer when the same page also needs literal graphs investors can read.
Free before paid. Start with Framer ChartJS for production charts and FrameCharts when you want plugin-driven variety at zero cost. Upgrade to Charts for Framer at 19 USD when Google Sheets sync saves hours each sprint; DataVizPro at 8 USD when API loading states and mobile fit matter more than chart-type breadth.
Our top pick for most Framer builders
Install Framer ChartJS first — it covers six chart types, goal lines, and multi-dataset formatting at no cost. Add FrameCharts when designers prefer building charts in a plugin before placing them on the page. When the brief says “numbers update from our Google Sheet,” Charts for Framer at 19 USD is the paid default that keeps marketing and finance aligned without custom backend work.
Browse free Framer templates on yoframer for SaaS and fintech starting points with metrics-ready sections, or read our analytics tools roundup when charts need real traffic data behind them. More curated lists live on the Resources hub.
Updated July 2026. We refresh this list as chart components ship breaking changes, reprice, or go stale.